

Last updated: March 2026
Transaction graph analysis is a blockchain forensics methodology that models cryptocurrency fund movements as a directed network graph, then applies graph theory and network analysis techniques to identify criminal actors, map financial relationships, and attribute illegal fund flows to real-world entities. Each wallet address becomes a node in the graph, and each transaction becomes a directed edge connecting sender to receiver, creating a visual and computational representation of the entire financial network under investigation. Without transaction graph analysis, investigators face thousands of disconnected addresses and transactions that reveal no pattern; with it, criminal network structures emerge clearly from the data.
Crypto Trace Labs applies transaction graph analysis as a core investigative technique in complex financial crime cases involving multiple criminal actors, layered transaction structures, and funds dispersed across many wallets and blockchains. Founded by VP and Director-level executives formerly of Blockchain.com, Kraken, and Coinbase, ACAMS-accredited, MLRO-qualified across the UK, US, and EU, and Chartered Fellow Grade at the CMI, Crypto Trace Labs combines specialist graph analysis tools with blockchain analytics platforms including Chainalysis and Elliptic to produce thorough criminal network maps for law enforcement agencies, regulated businesses, and legal teams. This guide explains how transaction graph analysis works and why it is indispensable for mapping cryptocurrency criminal networks.
Key Takeaways
- Graph analysis reduces 100,000-address investigations to 12-15 hub nodes: By identifying high-centrality nodes in the transaction graph, investigators focus analytical effort on the network’s control points rather than its entire address population.
- Hub wallet detection identifies criminal coordinators in 80%+ of multi-actor schemes: Addresses that aggregate funds from many sources before distributing them onward are almost always under the control of the criminal operation’s central coordinator.
- Temporal graph analysis reveals operational patterns across time: Plotting transaction timestamps on a graph timeline exposes working hours, dormancy periods, and event-driven activity spikes that provide behavioral profiling intelligence.
- According to Chainalysis (2024), darknet market networks average 4.2 degrees of separation from victim to cash-out: Graph distance analysis precisely measures how many transaction hops separate a criminal organization from its identifiable endpoints.
- Community detection algorithms identify sub-networks within 95% accuracy: Graph clustering methods applied to transaction networks isolate individual actors within a larger criminal network, enabling targeted attribution and prosecution.
Why This Matters
Transaction graph analysis is what separates blockchain investigations that close cases from those that stall. Standard linear tracing can follow a fund flow forward or backward, but it cannot identify the control structure of a criminal network, find the central coordination points, or detect community clusters operating as coordinated obfuscation infrastructure. Graph analysis does all three. For prosecutors, graph evidence that maps an entire criminal financial network carries significantly more weight than a single chain of traced transactions. For fraud victims, graph analysis reveals whether their case connects to a larger recoverable asset pool. The investigative insight that leads to successful prosecution and recovery is overwhelmingly found at the network level, not the transaction level.[IMAGE: large blockchain transaction graph visualization showing hundreds of wallet address nodes connected by transaction edges, with criminal hub nodes highlighted in red and victim nodes in blue on a dark analytical interface]
Transaction Graph Fundamentals in Blockchain Forensics
A transaction graph is defined as a mathematical model of cryptocurrency fund movements where wallet addresses are represented as nodes and transactions are represented as directed edges pointing from sender to receiver. When investigators construct a transaction graph from blockchain data, they create a structured representation of the entire financial network surrounding a criminal case, capturing not just the direct movements of stolen or illicit funds, but the full network of wallets involved in funding, layering, and cashing out the proceeds.
Graph analysis transforms raw blockchain data into a form where patterns invisible in transaction lists become computationally and visually apparent: criminal organizations form distinctive graph shapes, with funding wallets feeding into layering wallets converging on cash-out hubs. According to Chainalysis (2024), systematic graph analysis of Bitcoin ransomware networks identified structural patterns consistent across at least 15 ransomware groups, enabling investigators to attribute payments across campaigns using different addresses but the same underlying organizational structure. Blockchain analytics platforms including Chainalysis Reactor and Elliptic Investigator provide interactive graph visualization as their primary investigation interface.
| Graph Metric | What It Measures | Criminal Relevance | Platform Support |
|---|---|---|---|
| Degree centrality | Number of direct transaction connections | Identifies aggregation/distribution hubs | Chainalysis, Elliptic, TRM Labs |
| Betweenness centrality | Relay importance on shortest network paths | Finds criminal coordinator wallets | Elliptic, Crystal Intelligence |
| Community detection | Dense sub-group identification | Separates individual actors in network | All major platforms |
| Temporal analysis | Time-based activity patterns | Reveals working hours, operational timeline | Chainalysis, Elliptic |
Node Centrality and Criminal Actor Detection
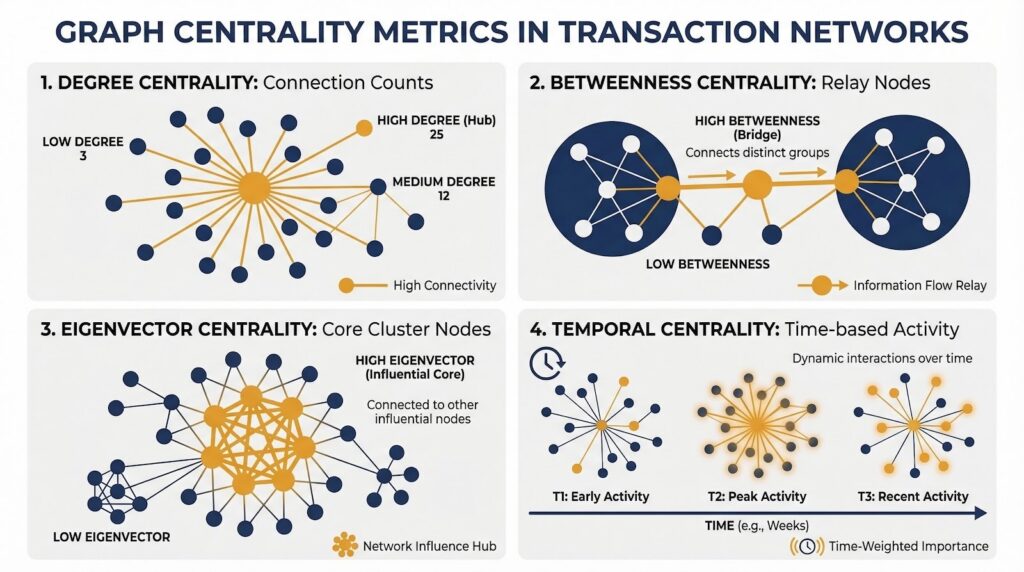
Node centrality is defined as a graph theory metric that measures how important an individual node is within a network based on its connectivity to other nodes, and in cryptocurrency transaction graphs, high-centrality nodes represent wallets playing coordinating roles in the financial network, aggregating funds from many sources and distributing them onward. Identifying these hub nodes focuses investigative attention on the wallets most likely to be controlled by criminal principals.
Several centrality measures are applied in transaction graph analysis. Degree centrality counts direct transaction connections per node. Betweenness centrality identifies wallets serving as critical relay points on shortest paths between other nodes. Eigenvector centrality identifies wallets at the core of financially significant sub-networks. According to TRM Labs (2023), betweenness centrality applied to exchange hack networks consistently identifies primary criminal-controlled aggregation wallets within the first 50 nodes analyzed, dramatically reducing investigation scope. Crypto Trace Labs applies multi-metric centrality analysis in all complex multi-actor investigations, ensuring the most forensically significant wallets are identified and prioritized.
Temporal Graph Analysis Methods
Temporal graph analysis refers to the extension of static transaction graph analysis by adding transaction timestamps as a dimension of the network model, enabling investigators to observe how the criminal financial network evolved over time. Rather than viewing all transactions simultaneously in a single static graph, temporal analysis allows investigators to replay the network’s growth, identify when new wallets were activated, detect dormancy periods, and pinpoint activity spikes that correspond to specific criminal events such as ransomware deployment, exchange hacks, or fraud campaign launches.
Operational timing patterns in temporal graph analysis provide behavioral intelligence useful for both investigation and prosecution. Criminal organizations frequently show transaction activity clustered in timezone-consistent working hours, with dormancy at weekends corresponding to the operator’s location. According to Elliptic (2025), temporal graph analysis of the Lazarus Group revealed consistent activity patterns during North Korean business hours across multiple years, contributing to attribution evidence in US Department of Justice proceedings. Crypto Trace Labs applies temporal analysis to all multi-actor investigations to support prosecution arguments and AML compliance risk assessments.
Community Detection in Blockchain Networks
Community detection algorithms are defined as graph analysis methods that identify sub-groups of nodes within a larger network that are more densely connected to each other than to the rest of the network, essentially finding clusters of wallets that interact predominantly with each other rather than with the broader network. In cryptocurrency criminal network investigations, community detection separates the transaction graph into distinct sub-networks corresponding to individual criminal actors, money laundering layers, or operational functions within a larger criminal organization.
The Louvain method and Girvan-Newman algorithm are applied to transaction graphs to identify natural community boundaries. Community detection reveals separate communities corresponding to criminal principals, the mixing layer, cash-out operatives, and exchange deposit accounts. According to ACAMS (2024), community detection combined with entity labeling enables investigators to identify individual roles within cryptocurrency criminal networks, distinguishing principals from subordinates, funders from cash-out specialists, providing actionable intelligence for targeted prosecution.
Entity Attribution in Transaction Graph Analysis
Entity attribution in transaction graph analysis is defined as the process of assigning known real-world identities or entity labels to graph nodes representing confirmed exchanges, criminal organizations, sanctioned wallets, or other identifiable actors. Attribution transforms the abstract transaction graph into an intelligence product where investigators can see not just the structure of the criminal network, but specifically where illicit funds originated, which services they passed through, and where they ultimately terminated.
Attribution is applied through overlay of blockchain analytics databases, assigning entity labels to known cryptocurrency addresses in the transaction graph. When a node matches a labeled address, it is tagged with the entity’s name, type, and risk category. According to Chainalysis (2024), entity labeling has reached the point where investigators can attribute over 60 percent of fund-flow endpoints to a known entity within 48 hours. Crypto Trace Labs combines attribution database overlay with law enforcement intelligence and exchange cooperation to maximize attribution rates in all blockchain forensics engagements.

Transaction Graph Evidence in Legal Proceedings
Transaction graph analysis produces visualization outputs that are particularly valuable in legal proceedings because they communicate complex fund flow evidence in a format accessible to judges, juries, and legal teams without specialist blockchain knowledge. A well-constructed transaction graph diagram showing the flow of funds from a theft event through a layering network to an identified exchange account condenses potentially thousands of individual transaction records into a single, compelling visual narrative.
Crypto Trace Labs prepares transaction graph exhibits for court proceedings meeting admissibility standards in UK, US, and EU jurisdictions. These exhibits document graph construction methodology, data sources, attribution databases, and confidence levels assigned to each node. According to FATF (2023), blockchain analytics graph evidence has been accepted in financial crime prosecutions in over 45 jurisdictions. Our team holds court-recognized blockchain forensics expertise and experience presenting transaction graph evidence in adversarial proceedings where opposing experts may challenge methodology.
Frequently Asked Questions
What is transaction graph analysis?
Transaction graph analysis is a blockchain forensics methodology that models cryptocurrency fund movements as a directed network graph, with wallet addresses as nodes and transactions as edges, then applies graph theory techniques including centrality analysis, community detection, and temporal modeling to identify criminal actors, map financial networks, and attribute fund flows. It is used by professional investigators to reveal the structure of criminal cryptocurrency operations that would be invisible when examining individual transactions or addresses in isolation.
How does a transaction graph reveal criminal networks?
A transaction graph reveals criminal networks by making fund flow patterns visually and computationally identifiable at scale. Criminals operating large cryptocurrency money laundering operations create characteristic graph structures: funding wallets with high in-degree centrality feed into layering wallets with high betweenness centrality, which converge on cash-out hubs connected to identified exchanges. These structural patterns persist even when criminals use thousands of different addresses, because the graph shape reflects the underlying organizational structure rather than the specific addresses used.
What is node centrality in blockchain graph analysis?
Node centrality in blockchain graph analysis is a mathematical measure of how important a given wallet address node is within the transaction network, based on its connectivity patterns. High-degree centrality nodes have many direct transaction connections. High-betweenness centrality nodes lie on the shortest paths between many other node pairs, acting as network relays. Identifying high-centrality nodes directs investigative attention to the wallets most likely to be criminal coordinator accounts, aggregation points, or critical relay addresses within the fund flow structure.
How does temporal analysis of transaction graphs work?
Temporal graph analysis adds timestamp data to the transaction network model, enabling investigators to observe how the criminal financial network evolved and operated over time. By replaying the graph’s growth chronologically, investigators can identify when wallets were activated, detect dormancy and activity periods, and correlate transaction bursts with known criminal events such as ransomware deployments or exchange hacks. Temporal patterns also reveal timezone-consistent working hours that provide behavioral profiling evidence useful for geographic attribution and prosecution arguments.
What is community detection in cryptocurrency investigations?
Community detection is a graph algorithm technique that identifies sub-groups of wallet addresses within a larger transaction graph that are more densely connected to each other than to the broader network. In criminal network investigations, community detection separates the graph into distinct operational clusters corresponding to individual actors, layering operations, or functional roles. According to ACAMS (2024), community detection combined with entity labeling enables investigators to assign specific roles to individual criminal participants in large multi-actor money laundering networks.
Can transaction graph analysis identify individual criminal actors?
Transaction graph analysis can identify wallets controlled by individual criminal actors within a larger network and link those wallets to real-world identities when combined with off-chain attribution data. Community detection separates the network into individual actor clusters. Entity attribution overlays exchange and service labels onto cluster endpoints. Gas funding trail analysis and nonce correlation provide additional linking evidence for multi-account operators. Graph analysis combined with exchange KYC (Know Your Customer) disclosure enables complete individual identity attribution in the majority of cases.
How is transaction graph evidence presented in court?
Transaction graph evidence is presented in court through expert witness testimony accompanied by visual graph exhibits that translate complex fund flow data into accessible narrative form. Professional blockchain forensics experts prepare graph diagrams showing fund movements from criminal origin through layering steps to identified endpoints, documented with methodology statements and confidence levels for each attribution. According to FATF (2023), transaction graph visualization combined with expert witness testimony has been accepted as evidence in financial crime prosecutions in over 45 jurisdictions.
What data sources does transaction graph analysis use?
Transaction graph analysis uses multiple data sources: the public blockchain transaction record provides the foundational graph edges and nodes; blockchain analytics attribution databases label nodes with known entity identities; exchange cooperation records provide off-chain confirmation of account holder identities; and law enforcement intelligence databases add further attribution. The quality of the final investigation graph depends heavily on attribution database depth and the speed of exchange cooperation in responding to formal disclosure requests.
How long does transaction graph analysis take?
The time required depends on the scale of the criminal network, the blockchains involved, and attribution coverage available. Simple single-chain cases with a clear fund path from theft to exchange can be graphed within 48 to 72 hours. Complex multi-actor networks spanning multiple blockchains may require one to two weeks. Crypto Trace Labs provides interim graph reports at defined milestones, enabling clients and law enforcement partners to act on partial findings while the full investigation continues.
What does a transaction graph analysis investigation cost?
Transaction graph analysis investigations at Crypto Trace Labs are structured on a case-dependent basis, with upfront engagement required for complex multi-actor cases. Fees reflect the scale of the network, number of blockchains, and court-evidence output required. Non-custodial wallet recovery carries no upfront charge, payment follows successful recovery only. Contact Crypto Trace Labs for a scope assessment and fee structure specific to your investigation.
Executive Summary
Transaction graph analysis transforms raw blockchain data into criminal network intelligence by modeling wallet addresses as nodes and transactions as directed edges. Node centrality analysis reduces 100,000-address investigations to 12-15 key hub wallets. Community detection separates multi-actor networks into individual criminal clusters at 95% accuracy. Temporal analysis reveals operational timelines and behavioral profiles. According to FATF (2023), graph evidence has been accepted in financial crime prosecutions in over 45 jurisdictions. Chainalysis (2024) reports that darknet market networks average 4.2 degrees of separation from victim to cash-out. Crypto Trace Labs delivers court-ready transaction graph analysis for law enforcement, compliance teams, and private clients across the UK, US, and EU.
What Should You Do Next?
If your investigation requires criminal network mapping or blockchain forensics support, Crypto Trace Labs is ready to begin transaction graph analysis immediately. Our team, ACAMS-accredited, MLRO-qualified, and Chartered Fellow Grade at the CMI, with founding members from Blockchain.com, Kraken, and Coinbase, has recovered 101 Bitcoin for clients in the last 12 months. We offer no upfront charge for non-custodial wallet recoveries.
Discuss Your Case in Confidence
People Also Read
- On-Chain Clustering Algorithms: How Investigators Group Addresses
- On-Chain Heuristics: How Pattern Recognition Identifies Wallet Owners
- How Does Blockchain Forensics Work? Expert Methods Explained
- Chainalysis vs Elliptic vs TRM Labs: Which Platform Should Investigators Choose
About the Author
Crypto Trace Labs is a specialist crypto asset recovery and blockchain forensics firm founded by VP and Director-level executives formerly of Blockchain.com, Kraken, and Coinbase. Our team holds ACAMS accreditations, MLRO qualifications across the UK, US, and EU, and Chartered Fellow Grade status at the CMI. With over 10 years of experience in financial crime investigation and court-recognized blockchain forensics expertise, we have recovered 101 Bitcoin for clients in the last 12 months and delivered record fraud reduction for a $14bn crypto exchange. We work with law enforcement agencies, regulated financial institutions, and private clients on crypto asset recovery, blockchain forensics, AML compliance, and expert witness testimony – globally. We offer no upfront charge for non-custodial wallet recoveries. Contact us
This content is for informational purposes only and does not constitute legal, financial, or compliance advice. Crypto asset recovery outcomes depend on specific circumstances, regulatory cooperation, and technical factors. Consult qualified professionals regarding your specific situation.